Hexbinning is a method for visualizing point data when many similar values mean there is a lot of overplotting. Although it originated in the data visualization field as a an enhancement to the traditional XY scatterplot, within the last few years hexbinning has been used more and more in cartography. (See this great blog post by Zachary Forest Johnson which traces this history and explains how to create hexbin maps using D3.js.)
I wanted to map police stops under the NYPD Stop and Frisk program (official source, easier to use version from NYCLU), but at city or borough scale, this just looks like a continuous carpet of dots. Visualizing that kind of dense point data is exactly what hexbinning is for.
My go-to tools are PostGIS, QGIS, and R, and all of them have methods for creating the necessary hexagonal grid (PostGIS wiki solution, QGIS MMQGIS plugin, R hexbin package). With R the advantages are customizability, reproducibility, and automation, at the cost of more time getting set up, so I wanted to try the other ways first. Usually I would want to run this kind of data manipulation completely in-database, so first I looked at creating the hexagon grid in…
PostGIS
…but I wasn’t happy with the solution. To begin with, if you look at the math, that isn’t even a regular hexagon:
SELECT st_translate(the_geom, x_series, y_series)
from generate_series(0 - 128, 10000 + 128, 128) as x_series,
generate_series(0 - 128, 10000 + 128, 256) as y_series,
(
   SELECT 'POLYGON((0 0,64 64,64 128,0 192,-64 128,-64 64,0 0))'::geometry as the_geom
   UNION
   SELECT translate('POLYGON((0 0,64 64,64 128,0 192,-64 128,-64 64,0  0))'::geometry, 64, 128)  as the_geom
) as two_hex
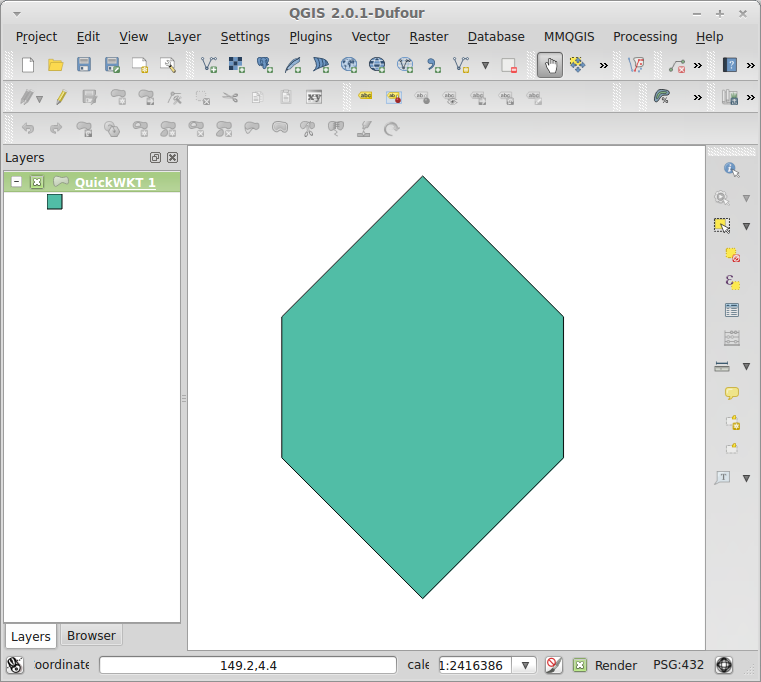
The distance between opposite sides is 128, and the distance between opposite vertices is 192, for a ratio of 0.666… or ⅔. A regular hexagon should have a ratio of cos(30°) ≅ 0.866. That this is not a regular hexagon is immediately obvious if you plot it in QGIS by pasting POLYGON((0 0,64 64,64 128,0 192,-64 128,-64 64,0 0)) into the QuickWKT plugin:
 Changing the query to draw a proper regular hexagon would not have been too difficult, but it also would have been a bit of work to figure out the origin, extent, and grid cell size of the hexagonal grid in relation to the feature (in this case, NYC borough) that you wanted to cover.
SpatiaLite
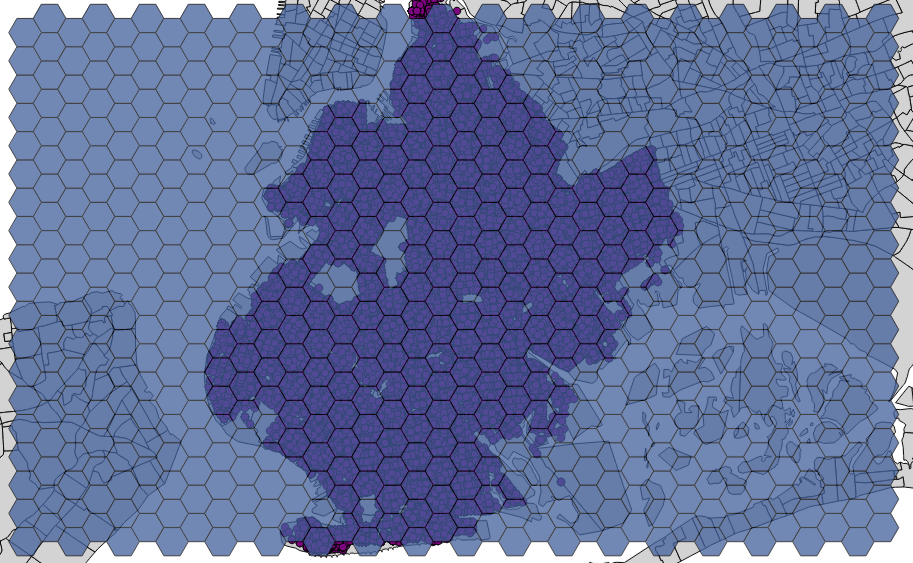
But I didn’t let go of doing this purely in spatial SQL just yet. SpatiaLite, a tool that I usually use for teaching rather than analysis, is actually ahead of PostGIS in that SpatiaLite 4.0 has added a variety of functions for creating tesselations based on recent additions to the GEOS library. The function, ST_HexagonalGrid(geometry, cell_size), is beautifully simple, and I was able to produce a hex grid that covered Brooklyn with half-mile wide hexagons. Unfortunately, the next step—spatially joining the hexagons to the points representing the police stops—proved problematic in two ways.
First, once I joined the hexagon layer and the point layer, I needed to UPDATE the hexagon layer with the count of the number of points that fell within each hexagon. To UPDATE one table based on values in another table is trivial in PostGIS and most major databases because they support using the FROM clause in an UPDATE statement, but amazingly this functionality is not part of the SQL standard and is not supported by SQLite (the database SpatiaLite is built on). I had never realized this because I’m doing most of my database work in PostGIS.
More importantly, the hexagonal grid was unusable as-is because it was a MULTIPOLYGON, a single geometry made up of many polygons. Since this is represented as one database row, the join would effectively join all the points in Brooklyn to the entire grid, rather than joining each point to the individual grid cell it fell into. What I needed to do is what GIS users call a Multipart-to-Singlepart operation, to split the MULTIPOLYGON into separate polygons, one geometry for each hex cell. I was again surprised to find that SpatiaLite lacks the equivalent of PostGIS ST_Dump(), which does exactly that. SpatiaLite was looking like more trouble than it was worth.
QGIS
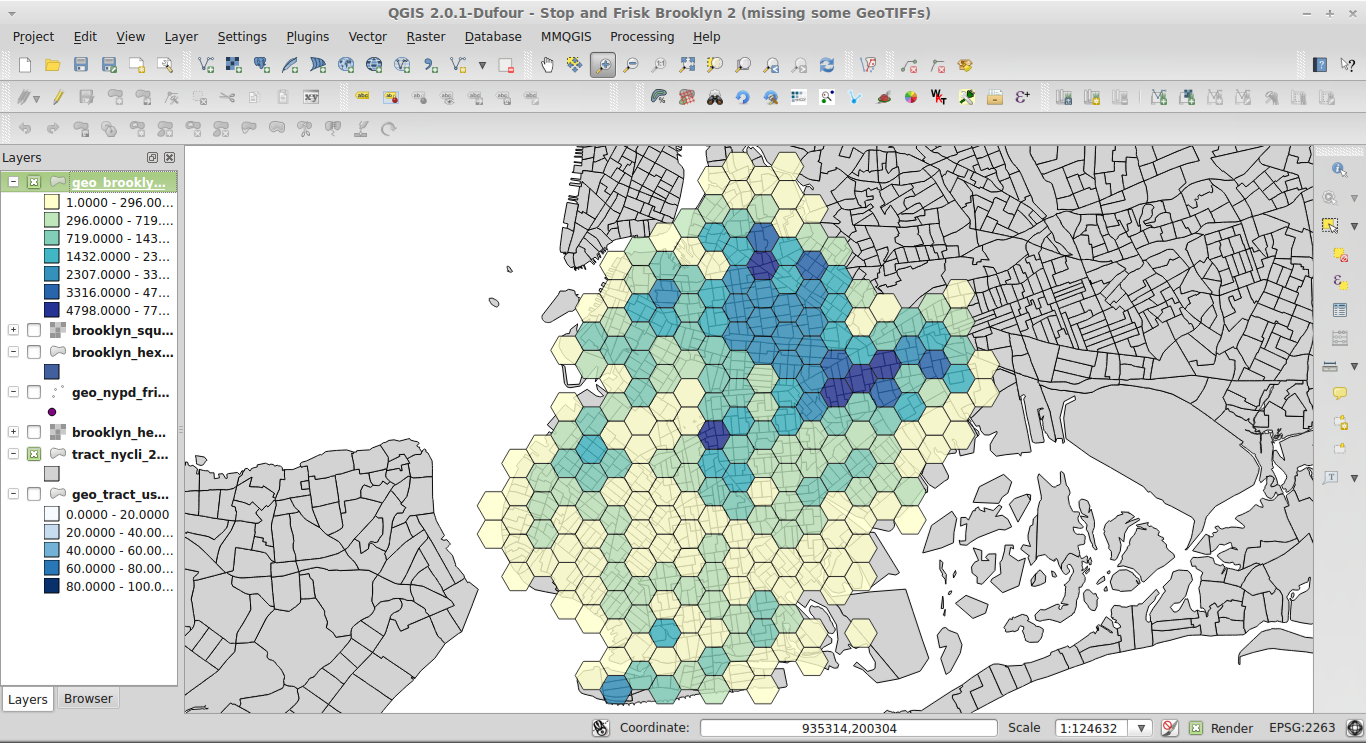
At this point I tried creating the hexagonal grid using the MMQGIS plugin in QGIS (MMQGIS → Create → Create Grid Layer). This proved quite easy. The plugin lets you set the extent and cell size for the grid (as well as choose other grids such as rectangular or diamond), but the extent defaults to covering the viewing area at your current zoom level in the map canvas, and the H spacing and V spacing are linked, so if you set one, the other updates to create a regular hexagon at the correct mathematical ratio. I zoomed in to Brooklyn and ran the tool:
 Now I had to do the points-in-polygon operation. The points layer is large. Even though I was just mapping Brooklyn in 2011, there were ~285,000 points. I tried to do this in QGIS using Vector → Analysis Tools → Points in polygon. First I did it using the NYPD Stop and Frisk table I had imported to PostGIS, but QGIS crashed repeatedly. (I tested with smaller tables, and they work fine.) So I exported the PostGIS layer to shapefile (uggh!) and tried the points-in-polygon operation again. This time it worked, but it took 2 hours to run! Now I was done, but I was not going to be satisfied until I came up with a faster way to do it.
Back to PostGIS
I was sure that this would run faster in PostGIS. Little did I realize how much faster. I imported the MMQGIS-created hexagon grid into PostGIS. Then I added a column to hold the count of stops in each hex cell, and ran the following query:
ALTER TABLE geo_brooklyn_hexgrid
ADD COLUMN nypd_stops integer;

UPDATE geo_brooklyn_hexgrid h
SET nypd_stops = point_count
FROM (
	SELECT a.gid, count(*) AS point_count
	FROM geo_brooklyn_hexgrid a JOIN geo_nypd_frisk_2011 b
		ON (ST_Contains(a.geom, b.geom))
	WHERE borough = 2 --Code for Brooklyn
	GROUP BY a.gid
	) c
WHERE h.gid = c.gid;
This code spatially joins the hex cells and the points each cell contains (ST_Contains(a.geom, b.geom)), counts (count(*)) the number of resultset rows with the same hex ID (GROUP BY gid), then writes the count to the field we just added to the hexagon grid table.
This query ran in 2 seconds.
Final versions of the maps are available at my Free City blog.